
In this project, my primary objective is to delve into the multifaceted influences on SAT scores among New York City high school students, focusing on a refined set of potential factors. I aim to investigate the following correlations between;
- Students’ gender and their SAT performance, scrutinizing how differences in gender may impact scores
- The relationship between the perceived safety of the school environment and SAT outcomes, considering how a sense of security might facilitate academic achievement
- The impact of racial demographics on SAT scores, seeking to understand the role race plays in educational equity and success
- Assessing the correlation between the average home sale prices in different boroughs and the safety perceptions of school environments, providing insights into how socio-economic factors intersect with educational contexts
This adjusted approach allows for a comprehensive understanding of the various dimensions that contribute to SAT performance in New York City’s diverse educational landscape. This research can potentially provide valuable insights that can help improve educational strategies and policies, ultimately leading to better academic outcomes for students in the New York City school system.
So, What is the SAT?
The SAT, or Scholastic Assessment Test, is a standardized test used for college admissions in the United States, assessing critical reading, writing, and mathematical skills. It consists of multiple-choice questions and a mandatory essay, totaling about three hours of testing. SAT scores play a significant role in determining a student’s eligibility for admission to various colleges and universities, acting as a key benchmark of academic readiness.
Linking Survey Responses to Academic Achievement on the SAT
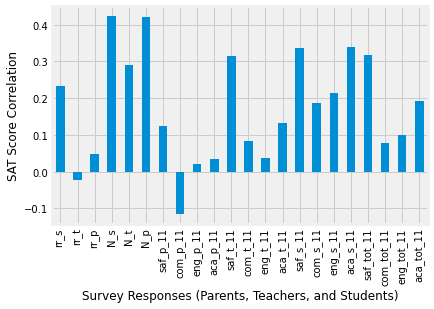
In my analysis of what influences SAT scores among New York City high schools, I discovered some interesting patterns. The factors that showed the strongest connection to better SAT performance were the number of students and parents who responded to surveys about the school. This suggests that schools where more students and parents are engaged enough to fill out surveys tend to have higher SAT scores. It’s an intriguing finding, as it hints at a broader theme of community involvement and its positive effects on a child’s academic achievement.
On the other hand, the factors with the least impact on SAT scores were the teacher response rate to surveys and the engagement score, which measures how involved and attentive students are in their classes. These areas showed very little connection to SAT performance. This was a bit surprising, as one might expect that teacher engagement and student attentiveness in class would play significant roles in academic success. However, according to the data, their influence on SAT scores is minimal.
It’s important to note that all of these correlations—both the strongest and the weakest—are considered weak according to statistical standards. Specifically, they all fall below a threshold that would indicate a strong relationship. This means that while we can observe some level of association between these factors and SAT scores, they are not the sole or dominant predictors of how well students perform on the exam. This insight is crucial for understanding the complexity of educational achievement and the many variables that can influence it.
Schools with Low Safety Scores
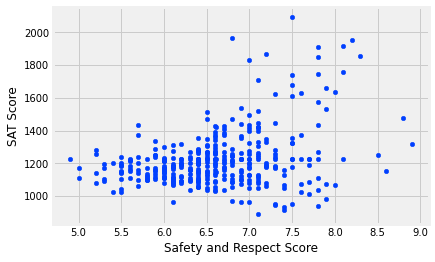
In analyzing safety scores, a clear pattern emerged: schools with lower safety scores often reported lower SAT scores as well. This finding suggests a significant link between a student’s learning environment and their performance on standardized tests. It indicates that when students feel unsafe, their focus and ability to learn may be compromised, leading to lower academic achievements.
This observation highlights the critical role that a safe and supportive school environment plays in student success. It suggests that efforts to improve school safety could have a positive impact on academic outcomes, including performance on important exams like the SAT. Therefore, enhancing school safety isn’t just about student well-being—it’s also a strategic approach to lifting academic performance across the board.
Average Safety Score per Borough
| Borough | Average Safety Score |
| Manhattan | 6.831370 |
| Queens | 6.721875 |
| Bronx | 6.606577 |
| Staten Island | 6.530000 |
| Brooklyn | 6.370755 |
Based on the computed safety scores averaged per borough, it’s clear that perceptions of safety within New York City’s educational environments vary across different boroughs.
The data reveals that Brooklyn is perceived as the least safe borough among the five, indicating that students and possibly staff in schools located within Brooklyn may have more concerns related to safety compared to their counterparts in other boroughs.
On the other end of the spectrum, Manhattan emerges as the borough with the highest average safety score. This suggests that schools in Manhattan are perceived as safer environments, which could be attributed to a variety of factors such as more resources allocated towards safety measures, the socio-economic context of the borough, or even differences in community engagement and policing strategies.
The disparities in safety scores highlight the importance of tailored approaches to address safety concerns, ensuring that all students can benefit from having a secure and conducive learning environment.
The Complex Role of Race in SAT Outcomes
In this section, we delve into the complex and multifaceted relationship between student demographics and academic outcomes, specifically focusing on SAT scores—a critical metric for college admissions in the United States. The SAT is designed to assess students’ readiness for college and provides a standardized measure that colleges use to evaluate applicants. However, disparities in SAT scores across different demographic groups can reveal underlying inequalities in access to education, resources, and opportunities.
Through statistical analysis, we aim to understand how race, among other factors, correlates with SAT performance across various schools. By examining these correlations, particularly the impact of racial composition on SAT scores, we aim to uncover systemic issues and highlight areas where targeted interventions could help bridge the gap in educational attainment.
This exploration is crucial for educators, policymakers, and communities striving to create more equitable educational environments where every student has the opportunity to succeed.
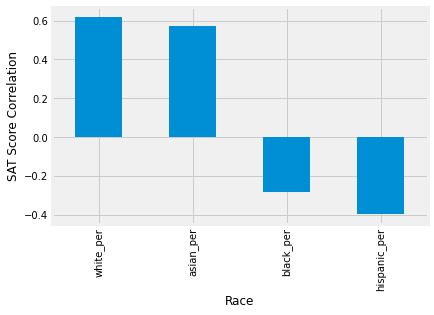
The analysis of the correlation between SAT scores and race, particularly focusing on Hispanic students, reveals a significant negative correlation of -0.4. This suggests that as the percentage of Hispanic students in schools increases, there’s a tendency for average SAT scores to decrease.
This finding could be indicative of various systemic and socio-economic challenges faced by Hispanic communities. Factors such as access to quality education, language barriers, economic disparities, and insufficient educational support may contribute to this negative correlation. It’s important to consider that correlation does not imply causation; thus, while there’s a clear association between higher proportions of Hispanic students and lower SAT scores, this relationship might be influenced by a complex mix of factors.
Addressing these disparities requires targeted interventions that could include enhancing language support, providing culturally responsive teaching, increasing access to college preparatory resources, and addressing socio-economic barriers that disproportionately affect Hispanic students.
Now, let’s delve into schools with low SAT scores while also having a significant presence of Hispanic students.
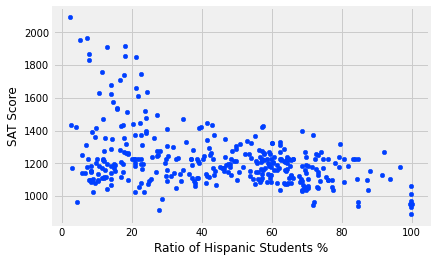
This scatterplot analysis focusing on the relationship between the percentage of Hispanic students in schools and their SAT scores provides compelling visual evidence of a pronounced trend: schools with a higher concentration of Hispanic students often face challenges in reaching the higher echelons of SAT performance.
Specifically, the data points to a distinct pattern where schools with less than 90% Hispanic students generally report better SAT outcomes, with scores frequently surpassing the 1200 mark. In stark contrast, institutions where Hispanic students make up more than 90% of the student body predominantly record SAT scores below 1200. This observation underscores the existence of systemic barriers that disproportionately affect schools with significant Hispanic populations, impacting their overall academic achievements. Factors contributing to this trend could include, but are not limited to, unequal access to quality preparatory resources, socio-economic disparities, and language barriers.
These findings highlight the urgent need for targeted educational policies and programs that address the specific needs of schools with high concentrations of Hispanic students, aiming to level the playing field and ensure that all students have the opportunity to excel academically, regardless of their racial or ethnic backgrounds.
Schools Where Hispanics Comprise 90% or More of the Student Body
| School No. | School Name |
| 44 | MANHATTAN BRIDGES HIGH SCHOOL |
| 80 | CITY COLLEGE ACADEMY OF THE ARTS |
| 81 | COMMUNITY HEALTH ACADEMY OF THE HEIGHTS |
| 82 | WASHINGTON HEIGHTS EXPEDITIONARY LEARNING SCHOOL |
| 84 | HIGH SCHOOL FOR INTERNATIONAL BUSINESS AND FIN… |
| 89 | GREGORIO LUPERON HIGH SCHOOL FOR SCIENCE AND M… |
| 125 | ACADEMY FOR LANGUAGE AND TECHNOLOGY |
| 141 | INTERNATIONAL SCHOOL FOR LIBERAL ARTS |
| 176 | PAN AMERICAN INTERNATIONAL HIGH SCHOOL AT MONROE |
| 253 | MULTICULTURAL HIGH SCHOOL |
| 286 | PAN AMERICAN INTERNATIONAL HIGH SCHOOL |
Schools with Under 10% Hispanic Population with SAT Scores Above 1800
| School No. | School Name |
| 37 | STUYVESANT HIGH SCHOOL |
| 151 | BRONX HIGH SCHOOL OF SCIENCE |
| 187 | BROOKLYN TECHNICAL HIGH SCHOOL |
| 327 | QUEENS HIGH SCHOOL FOR THE SCIENCES AT YORK CO… |
| 356 | STATEN ISLAND TECHNICAL HIGH SCHOOL |
From the observations made regarding race and SAT scores, it is evident that “Non-Hispanic” schools exhibit higher average SAT scores. Moreover, when examining schools with scores exceeding 1800, a notable pattern emerges, with such high-scoring schools specializing in Science and/or STEM subjects.
For instance, the Bronx High School of Science stands out as an exemplar, boasting eight Nobel Prize-winning alumni, seven in physics and one in chemistry. This remarkable school has achieved the distinction of producing the highest number of Nobel laureates in science among all secondary schools worldwide. However, it is noteworthy that the representation of Hispanic students in these specialized schools is comparatively low.
Exploring Gender Dynamics in SAT Success

Neither correlation is strong. A high percentage of females at a school positively correlates with SAT scores, whereas a high percentage of males at a school negatively correlates with SAT scores.
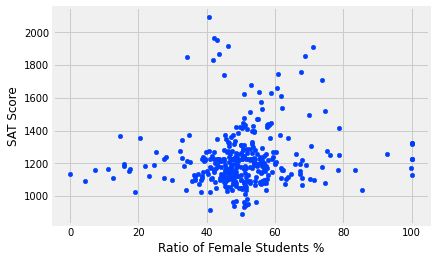
Based on the above plot, there doesn’t seem to be any real correlation between sat_score and female_per. However, there is a cluster of schools with a high percentage of females (60 to 80) and high SAT scores.
| School No. | School Name |
| 5 | BARD HIGH SCHOOL EARLY COLLEGE |
| 26 | ELEANOR ROOSEVELT HIGH SCHOOL |
| 60 | BEACON HIGH SCHOOL |
| 61 | FIORELLO H. LAGUARDIA HIGH SCHOOL OF MUSIC & A… |
| 302 | TOWNSEND HARRIS HIGH SCHOOL |
Insights and Observations
Schools that have over 60% of their students being female tend to score higher on SAT scores. The types of schools with scores over 1700, they were schools specialising in Science and/or STEM.
For example, “the Eleanor Roosevelt High School is a small public high school on the Upper East Side of Manhattan in New York City. Eleanor Roosevelt High School is composed of about 33 teachers and 500 students representing over 40 countries.”
This example shows that not only does this school benefit from the positive correlation of female to high SAT score data point, but as well, a benificiary of having a high safety score based on the borough (Manhattan has the highest safety score).
Safety Through the Eyes of Students and Teachers: Its Influence on Home Market Values
In this section, we delve into the nuanced relationship between average home sale prices and borough safety, as perceived through the lens of survey responses from students and teachers. These perceptions of safety, critical in shaping the atmosphere and appeal of various neighborhoods, potentially influence not only the living experience but also the real estate market dynamics within New York City’s boroughs.
By correlating the subjective safety scores gathered from educational stakeholders with the average sale prices of homes across different boroughs, our analysis seeks to unveil whether a perceivable connection exists between the sense of security in a community and its property values. This exploration is particularly insightful, considering that it merges quantitative real estate data with qualitative feedback on safety, offering a unique perspective on how these elements interact to define the desirability and economic vitality of urban areas.
This comprehensive approach not only contributes to our understanding of urban socio-economic trends but also underscores the value of listening to the voices within our schools to inform broader societal improvements.
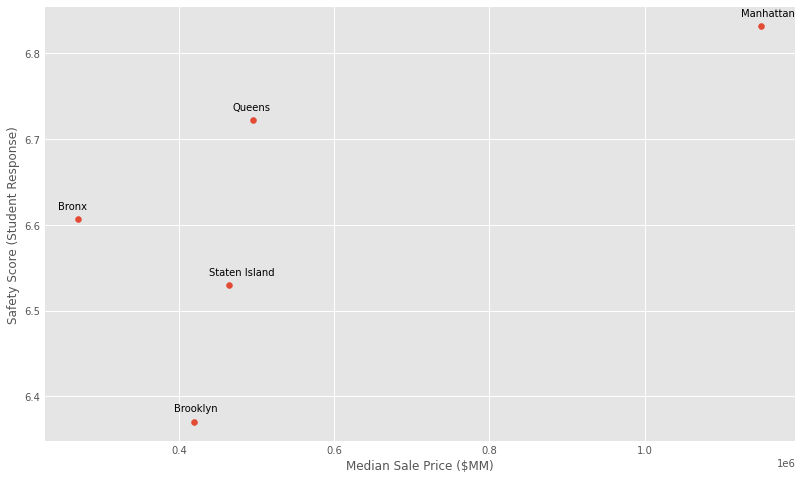
The analysis of the correlation between borough safety, as perceived by students and teachers, and average home sale prices reveals intriguing patterns within the New York City real estate market. Manhattan, recognized as the safest borough according to survey responses from educational communities, commands the highest average home sale prices. This finding aligns with the expectation that areas perceived as safer are more desirable, leading to increased demand and, consequently, higher property values. The premium on safety is a well-documented phenomenon in real estate markets, where peace of mind and quality of life are significant factors influencing purchasing decisions. Manhattan’s status as a highly sought-after location is further bolstered by its safety perceptions, reinforcing its position at the top of the real estate market.
Conversely, the analysis presents an anomaly in the expected correlation between safety perceptions and home sale prices when considering Brooklyn and the Bronx. Despite being perceived as the least safe borough, Brooklyn does not occupy the position of having the lowest average home sale prices; this distinction goes to the Bronx, which ranks as the third safest borough based on the survey responses.
This deviation suggests that factors beyond safety perceptions are at play in determining real estate values, including but not limited to, accessibility, amenities, historical prestige, and potential for future development. Brooklyn’s real estate market may benefit from a combination of cultural vibrancy, gentrification, and strategic location, factors that can offset negative safety perceptions to some extent.
Meanwhile, the Bronx’s lower property values, despite a higher safety ranking than Brooklyn, highlight the complex interplay of various socio-economic factors that influence real estate markets, suggesting that perceptions of safety are just one piece of the puzzle in urban real estate dynamics.
Conclusion
In conclusion, the analysis revealed several significant correlations pertaining to high and low SAT scores. Among the factors positively associated with high SAT scores, the most prominent were race and ethnicity, with White students exhibiting stronger performance. Additionally, boroughs with higher safety scores demonstrated a positive correlation with SAT success, suggesting that a safer environment might foster academic achievement. Furthermore, gender was found to be a contributing factor, with females displaying higher average SAT scores compared to males.
On the other hand, the study also identified correlations that negatively impacted SAT scores. Hispanic students, in particular, exhibited a stronger negative correlation with low SAT scores, suggesting that there may be underlying factors that hinder their academic performance. Boroughs with lower safety scores also demonstrated a negative correlation with SAT outcomes, indicating that a less safe environment might contribute to lower test scores. Finally, the analysis showed a slight disparity between genders, as male students displayed a slightly stronger negative correlation with low SAT scores compared to their female counterparts.
It is important to consider that these correlations do not imply causation, and numerous other factors may influence SAT performance. Nevertheless, understanding these patterns can help inform educators, policymakers, and stakeholders to implement targeted strategies to improve educational outcomes for different demographic groups and foster a more equitable learning environment. Further research and comprehensive approaches are necessary to address the complexities underlying standardized test scores and educational achievements.