
In the bustling world of Airbnb rentals, setting the perfect price is more of an art backed by science than mere guesswork. As I navigate through 2023 data, leveraging machine learning to predict rental prices emerges as a game-changer, especially in the competitive arenas of the globe’s most vibrant Airbnb hubs: Dubai, Los Angeles (LA), London, Miami, New York City (NYC), San Francisco, Sydney, Tokyo, and Toronto. This exploration is not just about analyzing numbers; it’s about unlocking the secrets behind what makes a rental listing successful and how you, as a host or investor, can make informed decisions to maximise your returns.
I’ll examine various factors, from location to property size, shape the market dynamics, empowering you with insights to thrive in the ever-evolving landscape of short-term rentals. Let’s embark on this adventure together, unlocking the power of predictive analytics to transform the way we approach Airbnb pricing.
Initial Exploratory Data Analysis (EDA)
Upon undertaking this project, my first step was to dive into the data through Exploratory Data Analysis (EDA), which provided me with a foundational understanding of the Airbnb landscape across the top cities last year. The insights gained from this initial phase were both intriguing and invaluable, setting the stage for the predictive modeling that would follow.
Here’s a glimpse into what the EDA revealed…
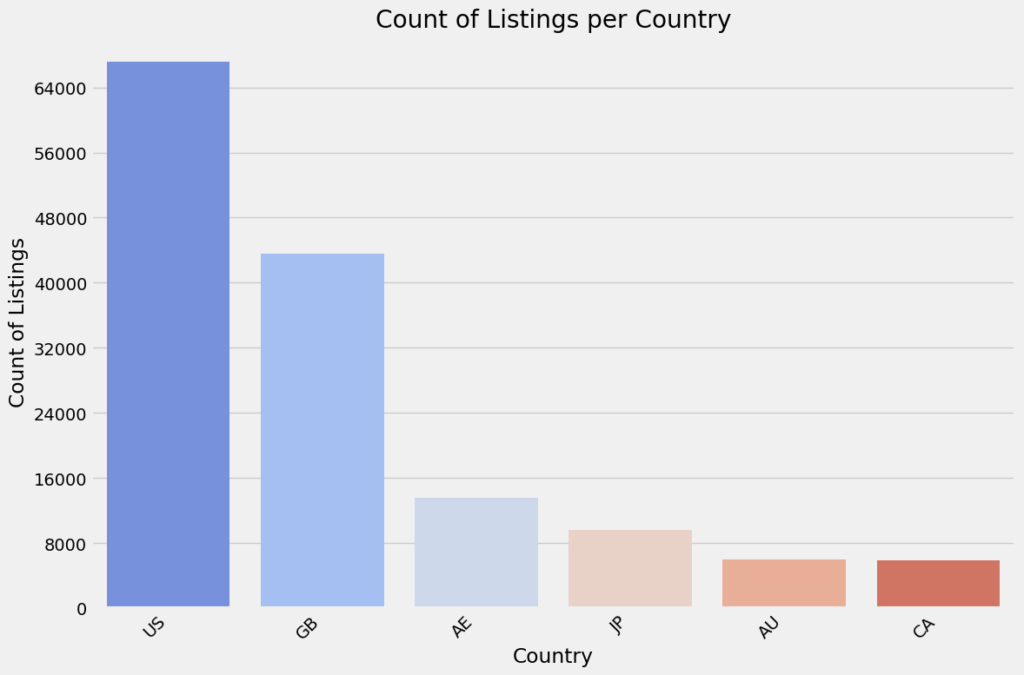
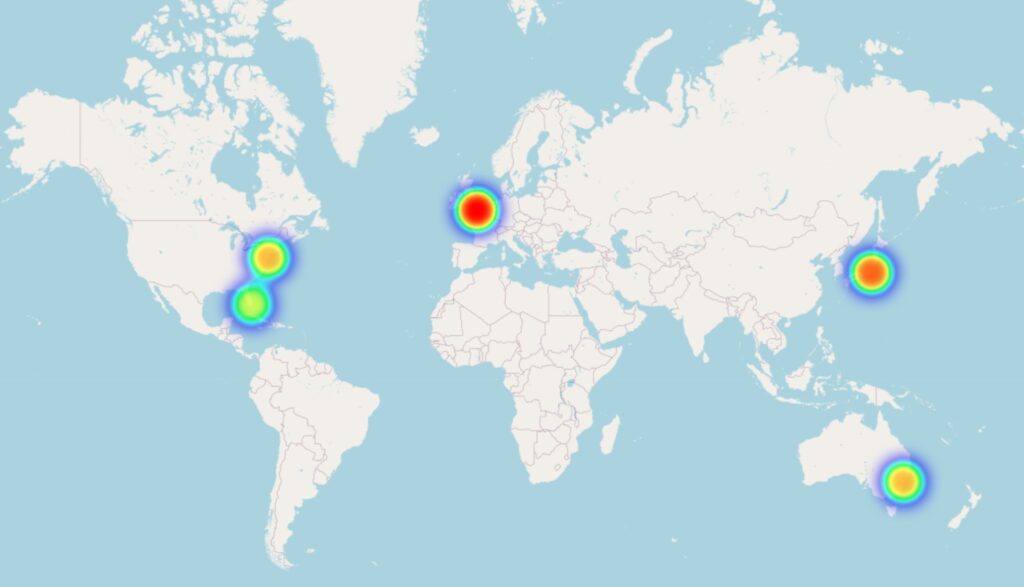
When it comes to the count of listings across countries, the U.S. stands out with an overwhelming majority of 67,186 listings, followed by Great Britain with 43,580. The dominance of the U.S. in the Airbnb market is further illuminated by this geographic concentration.
This concentration could skew perceptions of market saturation, suggesting that the U.S.’s overwhelming listing count partly reflects its multiple entries in the dataset. Meanwhile, Great Britain’s significant, though smaller, listing count, and Canada’s position at the lower end with fewer than 5,900 listings, indicate varied levels of market penetration and opportunities for growth within these regions.
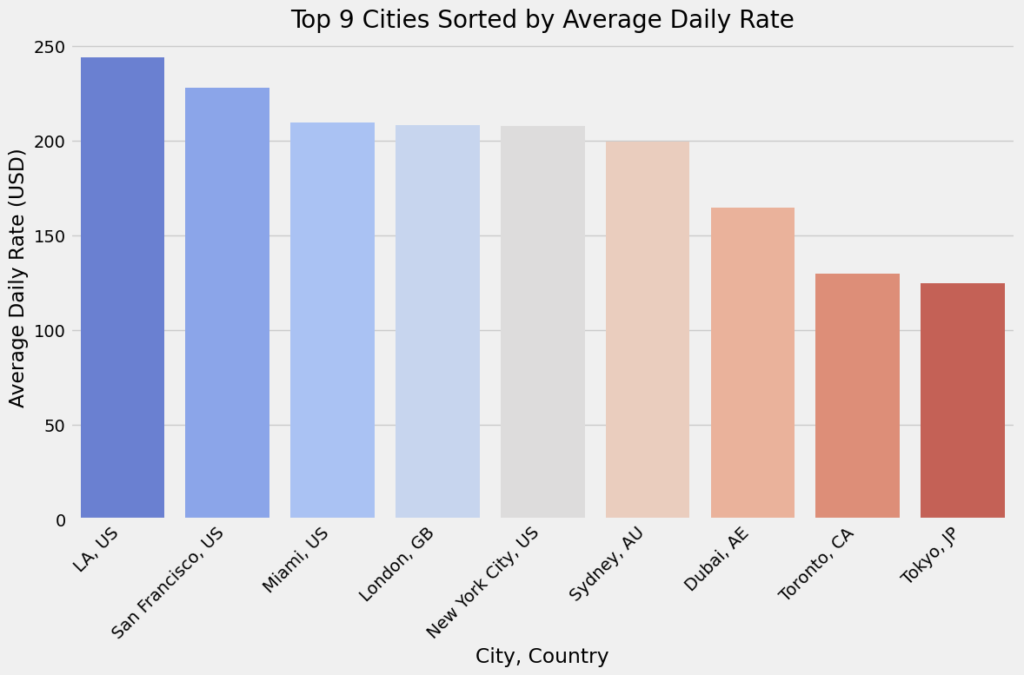
Going a layer deeper uncovers a fascinating landscape of Average Daily Rates (ADRs) across the globe’s most vibrant cities. At the peak of these findings, Los Angeles emerges at the top, commanding an impressive ADR of $243.86. This speaks volumes about the city’s allure, drawing travellers willing to splurge for the quintessential L.A. experience. Following closely are San Francisco and Miami, with ADRs of $227.77 and $209.60, respectively, highlighting the premium on accommodations in cities known for their unique cultural offerings and tourist attractions.
Crossing the Atlantic to London, we find the city holding its own with an ADR of $208.16, a testament to its draw as a hub of history, art, and fashion. New York City, the city that never sleeps, trails slightly behind at $207.72, underscoring its status as a high-demand destination for visitors worldwide. Meanwhile, Sydney stands out as the premier destination in the Southern Hemisphere, with an ADR of $199.25, suggesting a robust market for travellers seeking the Australian city’s sunny beaches and vibrant arts and entertainment scene.
Diving into more exotic locales, Dubai presents itself with an ADR of $164.65, reflecting its burgeoning reputation as a global tourist and business epicenter. The list then takes us to the quieter, yet culturally rich cities of Toronto and Tokyo, where the ADRs dip to more modest levels of $129.83 and $124.74, respectively. These figures hint at a broader range of accommodation options and differing visitor expectations.
This trek into the landscape of top cities revealed some interesting insights, laying a solid groundwork for nuanced predictive modelling.
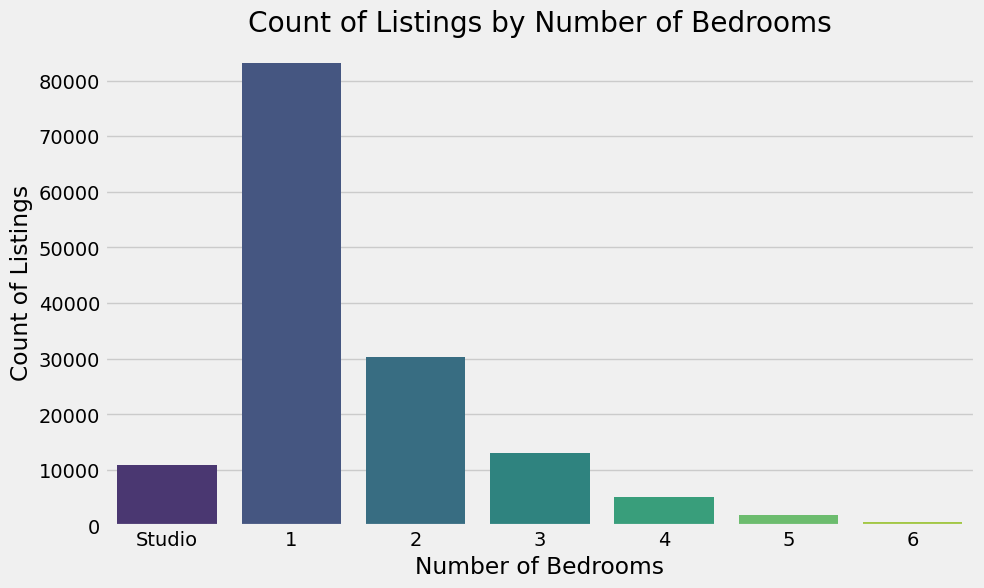
Lastly, an examination of listings by bedroom count reveals a clear preference for smaller accommodations, with one-bedroom properties dominating at 83,213 listings. This preference signals a strong market demand for solo travellers or couples seeking cozy and intimate settings for their stays.
As we ascend the scale of property sizes, there’s a noticeable decline in the count of listings, with two-bedroom properties at 30,358, followed by a more substantial drop-off for three-bedroom properties at 13,054, and continuing to decrease as the number of bedrooms increases. This trend not only reflects the reduced demand for larger properties but also highlights the niche market they occupy, catering to groups and families seeking more space and amenities.
Interestingly, the sharp decrease to 647 listings for six-bedroom properties illustrates the limited market for such large accommodations within the Airbnb platform. These insights paint a vivid picture of the current landscape of short-term rentals, where smaller accommodations reign supreme, driven by changing traveler preferences and the evolving dynamics of urban tourism.
In dissecting the 2023 Airbnb landscape, we’ve not just sifted through data; we’ve uncovered a narrative of evolving guest preferences and market dynamics. The clear preference for one-bedroom accommodations reveals a market tuning into the desires of solo travelers and couples, emphasizing the growing importance of convenience, authenticity, and location. This assessment not only sets the stage for predictive modeling but also signals a pivotal shift towards more nuanced, informed hosting strategies.
Decoding Airbnb Pricing
In the landscape of short-term rental investments, the endeavor for uncovering the most lucrative markets has yielded intriguing insights. Through a meticulous analysis of key metrics—Average Daily Rate (ADR), occupancy rates, booking counts, and overall market activity—I’ve mapped out a detailed terrain of opportunities for savvy investors.
At the forefront, London captivates with its blend of history, culture, and modern vibrancy. With an ADR of $208.16, a robust occupancy rate of 70.05%, and a staggering 636,761 bookings over the last twelve months, its allure to travellers is unparalleled, underscored by a composite score of 14.
On the other side of the world, Tokyo, despite its lower ADR of $124.74, boasts an impressive occupancy rate of 83.35%, signalling a high demand for accommodations. Sydney, marrying natural beauty with urban sophistication, also stands out as an attractive investment destination with an ADR of $199.25 and a composite score of 12.
Probing deeper into the dynamics of rental pricing, I went down a rabbit hole to decode the factors influencing Airbnb pricing, leveraging machine learning to predict prices based on actual prices from the dataset that’s adept at learning from the information I feed it.
I introduced the most compelling details I found to the machine learning model:
- How Busy a Place Is: By looking at the ‘Count Reservation Days LTM’ and ‘Number of Bookings LTM’, I gauged a property’s demand. It’s like noticing a restaurant that’s always full; you figure it must be offering something special.
- Popularity and Fullness: The ‘Occupancy Rate LTM’ tells us how often a place is occupied compared to available. A constantly occupied vacation home hints at a winner in the location lottery.
- The Competition: The ‘Listing Count’ helped us understand how many other options are out there. More listings mean more choices, akin to shopping in a busy market.
- Where It’s Located: Through ‘Latitude’ and ‘Longitude’, I captured the essence of location. After all, a beachfront view or a central city spot often justifies a higher price.
- Overall Performance: The ‘Composite Score’ summarised a listing’s overall appeal, combining various factors into one telling score. Think of it as a hotel’s star rating, guiding you at a glance.
Armed with this enhanced understanding, my model became capable of making nuanced price predictions. This is a bit like being able to predict the next big vacation spot before it trends, ensuring both hosts and guests can strike the best deal. By demystifying the data and focusing on what truly matters, I’ve managed to bridge the gap between guesswork and precision, making the Airbnb experience better for hosts and investors.
After a few iterations of training the model on specific features, I observed a notable leap in the accuracy of my rental price predictions. The measure of success, the Mean Absolute Error (MAE), which quantifies just how close my predictions come to the actual prices, showed a remarkable improvement.
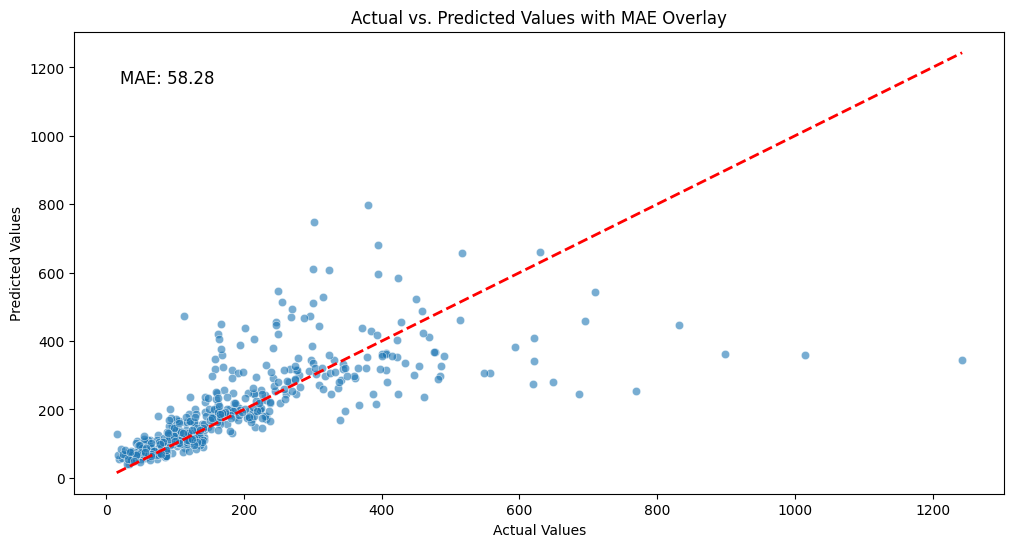
Initially my predictions wandered off the mark by a larger margin. However, with adjustments informed by my exploratory work, the MAE tightened significantly to 58.28. This figure means that on average, my predictions are now within about $58 of the actual rental prices—a testament to the precision I’ve achieved. This level of accuracy validates the effectiveness of insight-oriented decision making in unlocking the full potential of Airbnb listings.
Conclusion
On this adventure from collecting basic data to creating advanced models for predicting Airbnb prices, we’ve gone deep into the numbers, not just to look at them, but to find the stories they tell. We discovered important information about what makes prices change, from how many people want to stay to where the rental is located. This wasn’t just about looking at facts; it was about using these clues to make our model smarter, helping it catch all the little details that affect rental prices.
The big improvement came when I used a technique called XGBoost. This wasn’t just a small step forward; it was a giant leap that showed us our guesses about prices were getting really close to the mark. This wasn’t just about having better math; it was about giving people who rent out their places a map to navigate the tricky world of setting prices.
In the end, what we did is more than just play around with data. We found a way to use information to make better choices, making things better for both the people renting out their places and those staying in them. As I keep tweaking and improving my models, I see even more possibilities ahead, opening up new ways to understand and improve the renting and staying experience. This journey into figuring out Airbnb prices isn’t just about predicting costs; it’s about unlocking new ways to make everyone’s experience better.